
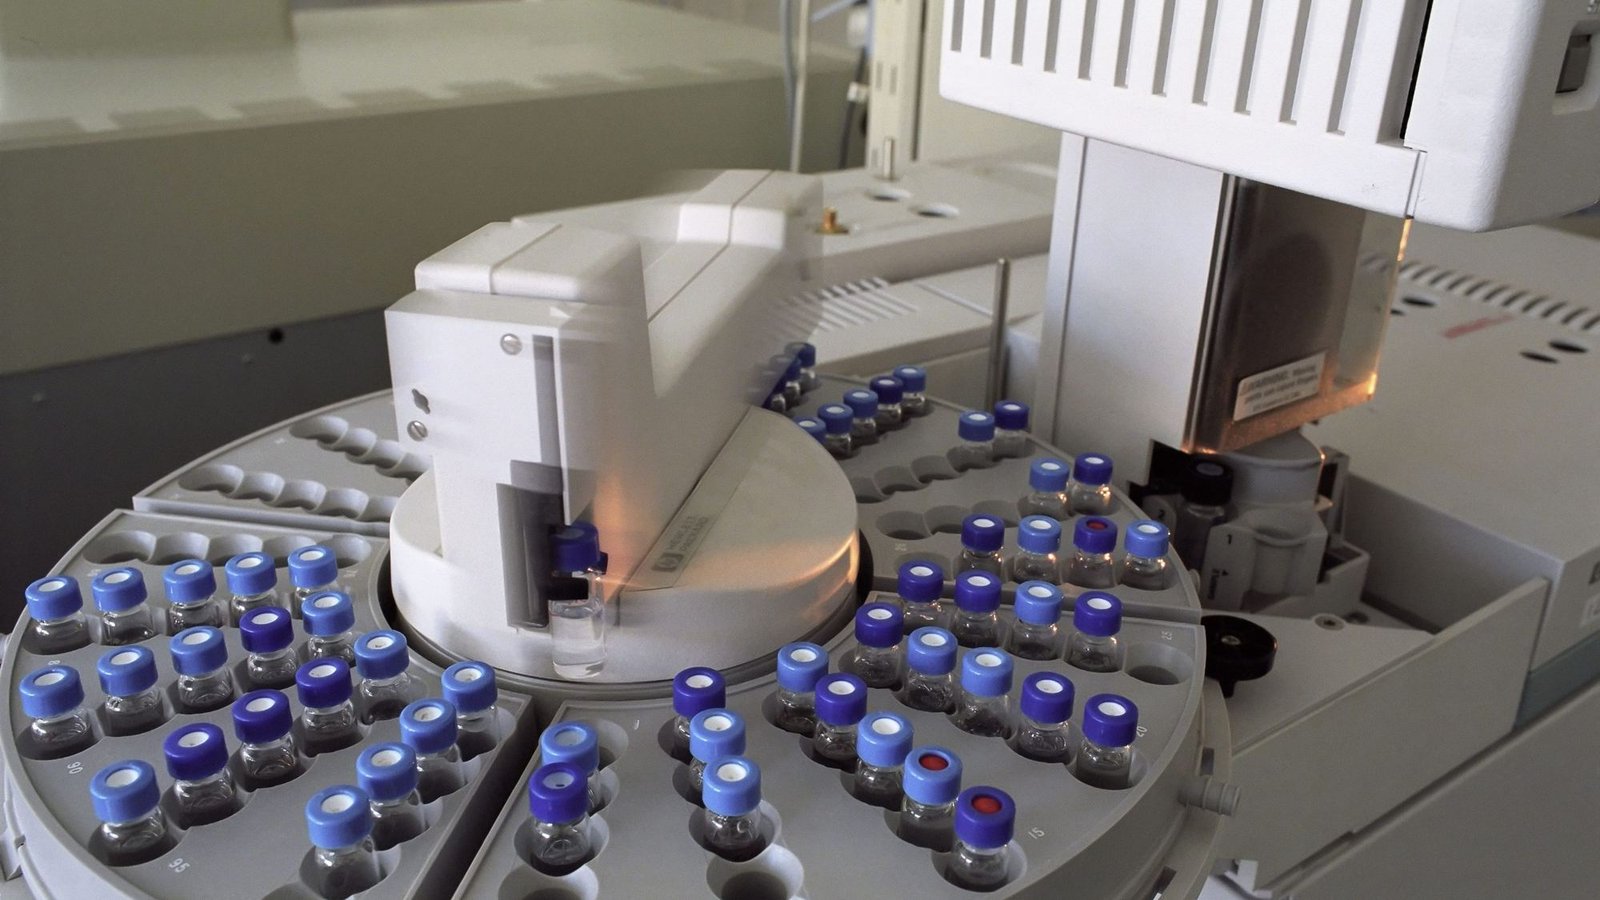
Small molecules,measured with the same rigour as proteins.
Untargeted profiling with stated annotation confidence, targeted panels with absolute quantification, and lipidomics across more than 30 classes, with statistics and figures included.
Untargeted
Untargeted metabolomics
Broad profiling of polar and non-polar metabolites, annotated with the confidence level stated.
Global metabolite profiling
HILIC and reversed-phase (C18) LC-HRMS in positive and negative mode, covering amino acids, organic acids, nucleotides, sugars, acylcarnitines and more.
Background and references
Standardised LC-MS procedures for serum and plasma, with pooled QC injections and strict run-order design, make untargeted profiling reproducible across hundreds of samples (Dunn et al., 2011; Broadhurst et al., 2018). We run HILIC and reversed-phase methods in both polarities and apply QC-based filtering before any statistics.
- Dunn WB et al. (2011). Procedures for large-scale metabolic profiling of serum and plasma using gas chromatography and liquid chromatography coupled to mass spectrometry. Nat Protoc 6:1060-83. PubMed · DOI
- Broadhurst D et al. (2018). Guidelines and considerations for the use of system suitability and quality control samples in mass spectrometry assays applied in untargeted clinical metabolomic studies. Metabolomics 14:72. PubMed · DOI · Free full text
Annotation and identification
Accurate mass, isotope pattern, retention time and MS/MS matched against HMDB, KEGG, METLIN and in-house spectral libraries; each feature carries an MSI confidence level.
Background and references
Every reported feature carries an identification confidence level, following the Metabolomics Standards Initiative (Sumner et al., 2007) and the five-level scheme of Schymanski et al. (2014). Level 1 identifications are matched to authentic standards run in-house; lower levels are stated as such in the report.
- Sumner LW et al. (2007). Proposed minimum reporting standards for chemical analysis Chemical Analysis Working Group (CAWG) Metabolomics Standards Initiative (MSI). Metabolomics 3:211-221. PubMed · DOI · Free full text
- Schymanski EL et al. (2014). Identifying small molecules via high resolution mass spectrometry: communicating confidence. Environ Sci Technol 48:2097-8. PubMed · DOI
Differential abundance and pathway analysis
Normalisation, batch correction, statistics with FDR control and pathway enrichment against KEGG and MetaCyc.
Background and references
Normalisation, QC-based filtering, univariate and multivariate statistics and pathway enrichment run in a documented workflow; MetaboAnalyst 6.0 (Pang et al., 2024) is one of the tools we use and the one most clients can reproduce themselves. Results come with the parameter files.
- Pang Z et al. (2024). MetaboAnalyst 6.0: towards a unified platform for metabolomics data processing, analysis and interpretation. Nucleic Acids Res 52:W398-W406. PubMed · DOI · Free full text
Exposome and xenobiotics
Profiling of drugs, drug metabolites and environmental compounds alongside endogenous metabolites.
Background and references
The exposome covers all non-genetic exposures, and high-resolution MS is the main tool for measuring chemicals and their metabolites alongside endogenous metabolism (Vermeulen et al., 2020). We profile drugs and environmental compounds in the same runs as the endogenous metabolome.
- Vermeulen R et al. (2020). The exposome and health: Where chemistry meets biology. Science 367:392-396. PubMed · DOI · Free full text
Stable-isotope tracing
13C or 15N tracer experiments for pathway activity, analysed with isotopologue correction (scoped per project).
Background and references
Tracing ¹³C- or ¹⁵N-labelled nutrients through metabolism reveals pathway activity that steady-state levels cannot, provided natural-abundance correction and sampling times are handled correctly (Jang et al., 2018). We design the tracer experiment with you and report isotopologue distributions.
- Jang C, Chen L, Rabinowitz JD (2018). Metabolomics and Isotope Tracing. Cell 173:822-837. PubMed · DOI · Free full text
Targeted
Targeted metabolomics
Absolute quantification of defined compounds against authentic standards and calibration curves.
Energy metabolism panel
Glycolysis, TCA cycle and pentose-phosphate intermediates, nucleotides and cofactors.
Background and references
Glycolytic and TCA intermediates, nucleotides and cofactors are polar and anionic and need dedicated chromatography; the ion-pairing reversed-phase Orbitrap method of Lu et al. (2010) is the basis of our central-carbon panel. Quantification uses labelled internal standards.
- Lu W et al. (2010). Metabolomic analysis via reversed-phase ion-pairing liquid chromatography coupled to a stand alone orbitrap mass spectrometer. Anal Chem 82:3212-21. PubMed · DOI · Free full text
Amino acids and derivatives
Proteinogenic and non-proteinogenic amino acids, polyamines and related metabolites.
Background and references
Underivatised amino acids are quantified by HILIC-MS/MS in a few minutes per sample with isotope-labelled standards, a method validated for plasma by Prinsen et al. (2016). We extend the panel to polyamines and related metabolites when a study needs them.
- Prinsen HCMT et al. (2016). Rapid quantification of underivatized amino acids in plasma by hydrophilic interaction liquid chromatography (HILIC) coupled with tandem mass-spectrometry. J Inherit Metab Dis 39:651-660. PubMed · DOI · Free full text
Fatty acids, acylcarnitines and bile acids
Short- and long-chain fatty acids, acylcarnitine profiles and primary and secondary bile acids.
Background and references
Primary and secondary bile acids and their conjugates are quantified by UPLC-MS/MS against labelled standards (Sarafian et al., 2015); acylcarnitines and fatty acids follow comparable targeted methods. These panels are the usual entry point for metabolic-disease and microbiome studies.
Neurotransmitters and one-carbon metabolism
Catecholamines, tryptophan and kynurenine pathway, folate and methionine cycle compounds.
Background and references
Tryptophan and kynurenine pathway metabolites, B-vitamin markers and inflammation-related compounds can be measured together in plasma by LC-MS/MS (Midttun et al., 2009). Our neurotransmitter and one-carbon panels follow the same approach.
Custom panels and single compounds
Method development for the compounds your study needs, including drugs and their metabolites in plasma and tissue.
Background and references
A targeted method is only as good as its validation. We follow the QC and system-suitability guidance written for clinical metabolomics (Broadhurst et al., 2018) and report linearity, precision and recovery for each custom compound.
- Broadhurst D et al. (2018). Guidelines and considerations for the use of system suitability and quality control samples in mass spectrometry assays applied in untargeted clinical metabolomic studies. Metabolomics 14:72. PubMed · DOI · Free full text
Lipidomics
Lipidomics
From shotgun class-level profiling to molecular-species quantification.
Untargeted lipidomics
LC-MS/MS and shotgun lipidomics covering glycerophospholipids, sphingolipids, glycerolipids, sterols and fatty acyls, more than 30 classes, with class-matched internal standards.
Background and references
Lipid extraction, class-matched internal standards and shorthand annotation that states only what the data support are the three pillars of a reliable lipidomics study (Züllig et al., 2020; Liebisch et al., 2020). We report lipids at the level the fragmentation supports and never beyond it.
- Züllig T, Trötzmüller M, Köfeler HC (2020). Lipidomics from sample preparation to data analysis: a primer. Anal Bioanal Chem 412:2191-2209. PubMed · DOI · Free full text
- Liebisch G et al. (2020). Update on LIPID MAPS classification, nomenclature, and shorthand notation for MS-derived lipid structures. J Lipid Res 61:1539-1555. PubMed · DOI · Free full text
Targeted lipid panels
Ceramides and sphingolipids, oxylipins and eicosanoids, cholesterol esters and triglyceride species quantified against labelled standards.
Background and references
Molecular ceramides and other sphingolipids are quantified by validated high-throughput LC-MS/MS assays (Kauhanen et al., 2016), and the plasma lipidome survey of the LIPID MAPS consortium (Quehenberger et al., 2010) sets expectations for concentration ranges. We quantify against labelled standards for each class.
- Kauhanen D et al. (2016). Development and validation of a high-throughput LC-MS/MS assay for routine measurement of molecular ceramides. Anal Bioanal Chem 408:3475-83. PubMed · DOI
- Quehenberger O et al. (2010). Lipidomics reveals a remarkable diversity of lipids in human plasma. J Lipid Res 51:3299-305. PubMed · DOI · Free full text
Lipid mediators and signalling lipids
Low-abundance eicosanoids, endocannabinoids and lysophospholipids by targeted LC-MS/MS.
Background and references
Eicosanoids, endocannabinoids and lysophospholipids are present at nanomolar levels and oxidise easily; the plasma survey of Quehenberger et al. (2010) shows how diverse they are. Targeted LC-MS/MS with antioxidant handling from collection onwards is the only reliable approach.
- Quehenberger O et al. (2010). Lipidomics reveals a remarkable diversity of lipids in human plasma. J Lipid Res 51:3299-305. PubMed · DOI · Free full text
Membrane and tissue lipid composition
Lipid class and fatty-acyl composition of membranes, tissue, lipoproteins and extracellular vesicles.
Background and references
Membrane lipid composition differs between organelles, tissues and species, and this diversity shapes membrane function (Harayama and Riezman, 2018). We profile lipid classes and fatty-acyl composition of membranes, lipoproteins and extracellular vesicles.
Multi-omics
Metabolomics with proteomics
Two molecular layers from one sample tell a more complete story.
One aliquot, two omes
Si-Trap™ recovers the lipid and metabolite fraction before the protein is digested, so proteomics and lipidomics come from the same sample.
Background and references
Extracting metabolites, lipids and proteins from one aliquot removes the sample-to-sample variation of parallel extractions; Coman et al. (2016) demonstrated this with the SIMPLEX approach. Si-Trap™ applies the same idea in a spin-column format that leads straight into S-Trap™ digestion.
- Coman C et al. (2016). Simultaneous Metabolite, Protein, Lipid Extraction (SIMPLEX): A Combinatorial Multimolecular Omics Approach for Systems Biology. Mol Cell Proteomics 15:1453-66. PubMed · DOI · Free full text
Correlation networks and pathway maps
Metabolite changes linked to enzyme abundance and phosphorylation state in the same pathway map.
Background and references
mixOmics provides sparse multivariate methods for linking metabolite, lipid and protein data measured on the same samples (Rohart et al., 2017). We deliver correlation networks and pathway maps together with the code that produced them.
- Rohart F et al. (2017). mixOmics: An R package for 'omics feature selection and multiple data integration. PLoS Comput Biol 13:e1005752. PubMed · DOI · Free full text
Sample types
Plasma, serum, urine, CSF, tissue, cells, culture medium, faeces and plant material.
Background and references
Every matrix needs its own extraction and QC scheme, and the guidance of Broadhurst et al. (2018) on QC and system-suitability samples applies to all of them. Our submission guide lists amounts, tubes and storage conditions per sample type.
- Broadhurst D et al. (2018). Guidelines and considerations for the use of system suitability and quality control samples in mass spectrometry assays applied in untargeted clinical metabolomic studies. Metabolomics 14:72. PubMed · DOI · Free full text
Choosing
Untargeted or targeted?
| Untargeted | Targeted | |
|---|---|---|
| Question | Which metabolites or lipids changed? | How much of these compounds is present? |
| Compounds | Hundreds to thousands of features; annotation confidence varies | Tens to a few hundred, identified and quantified absolutely |
| Quantification | Relative, between groups | Absolute, with calibration curves |
| Standards | Internal standards for QC | Authentic and labelled standards for every analyte |
| Best for | Discovery, hypothesis generation | Validation, clinical and intervention studies |
| Usual sequence | Run first | Run on the compounds discovery pointed to |
How a project runs
From samples to answers.
- 01
Design
Question, groups and sample handling agreed; pooled QC and randomised order planned.
- 02
Extract
Biphasic or single-phase extraction matched to the sample; internal standards added at the first step.
- 03
Acquire
HILIC and C18 LC-HRMS in both polarities, or targeted LC-MS/MS with calibration curves.
- 04
Analyse
Peak picking, annotation, normalisation, statistics and pathway mapping; figures and tables delivered.
What to send
Sample requirements.
| Sample | Amount | Notes |
|---|---|---|
| Plasma or serum | 50 to 100 µL per replicate | Collected consistently; frozen within 1 h |
| Urine | 0.5 to 1 mL | First-morning void preferred; creatinine normalised |
| Tissue | 10 to 50 mg | Snap-frozen; avoid thawing |
| Cells | 1 million cells per replicate | Quenched and washed before freezing |
| Culture medium | 0.5 to 1 mL | Include blank medium |
Guide values; we confirm amounts for your sample type before shipping. See the sample submission guide.
What you get
Deliverables.
- Feature table with annotations and MSI confidence levels, or absolute concentrations for targeted panels
- QC report: pooled-QC CVs, internal-standard recovery, batch assessment
- Statistics with FDR control, PCA, volcano plots and pathway enrichment
- For lipidomics: class and species tables with fatty-acyl composition
- Methods text, R scripts and optional interpretation session
Questions we are asked most.
50 to 100 µL of plasma or serum per replicate for untargeted metabolomics or lipidomics; tissue from 10 mg; cells from one million.
Yes. A biphasic extraction yields a polar and a lipid fraction from the same aliquot.
Targeted panels are absolute, against calibration curves with authentic standards. Untargeted data are relative between groups.
Every annotation carries an MSI level: level 1 is confirmed with a standard, level 2 is a spectral-library match, level 3 is a class-level assignment. We state it, so you can judge it.
One laboratory, six ways in.
Most projects combine two of these. The same scientists scope, run and analyse all of them, so a proteomics study can pick up metabolomics, sequencing or a structural question without changing provider.
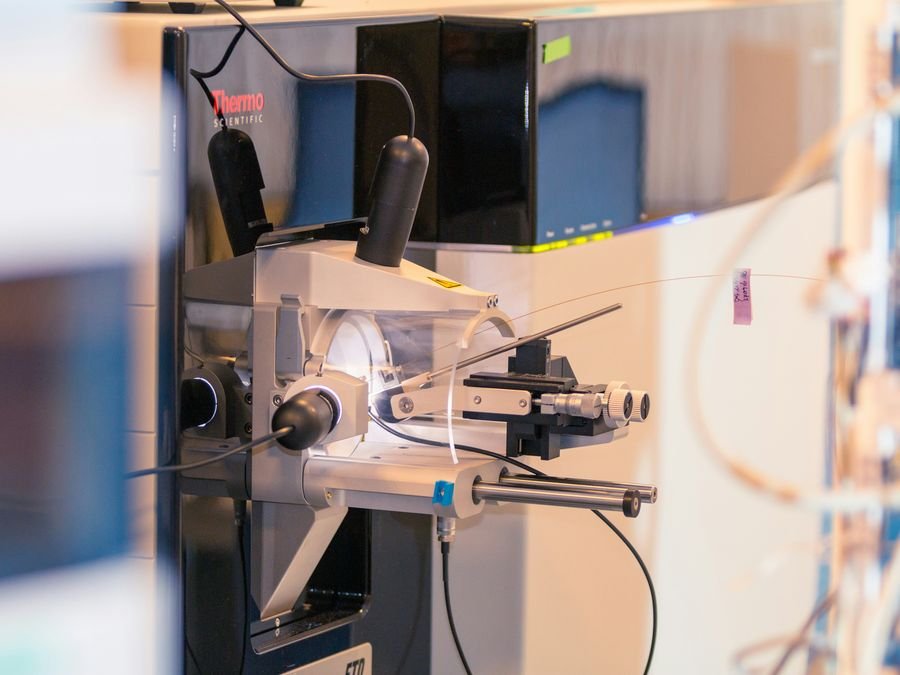
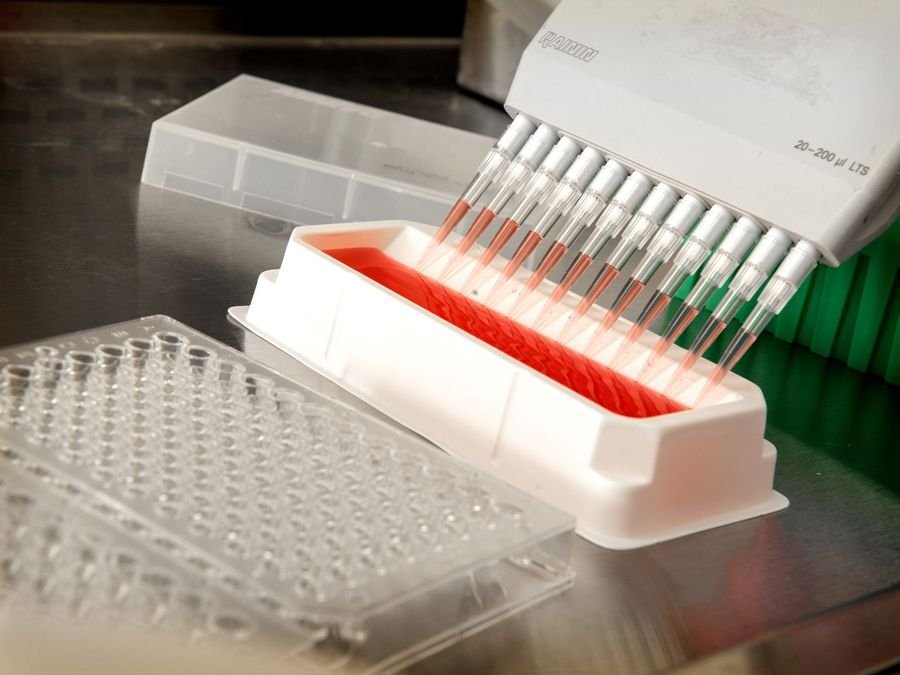


Plan a metabolomics or lipidomics study.
Tell us the sample type, the comparison and whether you need absolute amounts. We will propose untargeted, targeted or both.